The canvas & interface
How the DreamSheets workspace behaves — the canvas, cards, selection, panels, tabs, menus, and theming.
The DreamSheets window is a canvas: a large scrollable surface holding cards — tables, tiles, charts, scripts, and media. This page covers how the workspace itself behaves; the individual object types have their own pages.
The canvas
- Panning is ordinary scrolling — scroll wheel, trackpad, or the scrollbars. There's no special pan mode to learn.
- The surface grows automatically as you drag cards outward, so you never run out of room.
- Everything snaps to a 20px dot grid, and alignment guides appear while dragging so cards line up cleanly.
- Drag on empty canvas to rubber-band: release over nothing to draw a creation rectangle (a popup offers Table or Tile at that size), or sweep across cards to select a group.
Cards: select, move, resize
- Click a card to select it. Shift-click (or Ctrl-click) toggles cards in and out of a multi-selection; a rubber-band drag selects a group. Escape deselects.
- Drag the header to move; drag any of the 8 handles (corners and edges) to resize. Each gesture is one undo step.
- Arrow keys nudge the selected card by one grid step.
- Tab / Shift+Tab cycle through cards on the current tab; Enter on a selected table jumps into its first cell.
- Ctrl+Delete (or Ctrl+Backspace) deletes the selected card(s) — tables, charts, and tiles ask first; shapes, images, and scripts delete immediately, since Ctrl+Z brings them straight back. (Plain Delete works on cell contents, like Excel — see keyboard shortcuts.)
- Cards can be minimized to just their header, or temporarily maximized into an overlay.
- Shapes and images additionally support z-ordering (bring to front, send to back…) and rotation via a knob on the card.
Sections
Insert → Section drops a titled frame on the canvas. Anything whose centre sits inside the frame belongs to it — there's no list to maintain, so cards join and leave just by being dragged. Dragging a section by its title strip moves everything inside it; the frame itself is click-through, so you can still rubber-band select over it. Deleting a section leaves its contents alone.
Right-click the title for Rename, Style (Solid or Dotted) and Auto-Fit. With Auto-Fit on, the frame keeps itself wrapped around whatever it holds — move a card and the frame follows in the same undo step. Leave it off to size the frame by hand with the resize handles. Sections appear in the Directory with a live count of what they group.
Lineage arrows
DreamSheets draws arrows between cards showing how data flows: from tables into the charts and tiles that read them, from source tables into query tables, and from scripts to the tables they produced. Each card's menu can hide its incoming or outgoing arrows if a dense document gets noisy. To draw your own labeled arrows, see connectors.
The menu bar
- File — New, Open / Open Recent, Save/Save As, Import CSV / Import Excel, Export… (the multi-format export dialog), Print / Save as PDF, Merge Files (the three-way file merge), Database Connections, the DreamSheets Cloud block — Sign In/Out, Open from Cloud, Save to Cloud, Share, Sync Changes, Version History (entries appear as they apply: most only while signed in, the merge entries only when your copy has diverged) — and License….
- Edit — Undo/Redo, View Change History, Find / Find and Replace, Fill Down (Ctrl+D) / Fill Right (Ctrl+R), Custom Functions, Configure Hotkeys.
- View — Command Palette, Present (full-screen view, F5), Directory panel, Appearance (System/Light/Dark), Colors (theme editor), Canvas Zoom (In/Out/100%/Fit — the canvas only), Interface Size (the whole app, canvas included — for readability), Table View: Auto Expand / Full Table (switch the selected table's display mode), Size to Fit (size the selection to its content — see Size to Fit), Default Format, Table Scroll Speed, and Show AI Features — the way back after AI → Hide All AI Features.
- Insert — Table, Tile, Chart, Dashboard (compose a dashboard tab from the document's existing charts and tiles), Linked Table (query table), Table from Database, Script (one entry per installed language — Python, and R if detected), Shape, Section, Connector, Image.
- Data — Sort Column ↑ (A→Z) / ↓ (Z→A), Filter Column…, Conditional Formatting… — each acts on the currently selected column.
- Tools — Solver, Statistics, Plugin Manager, plus any commands installed plugins add.
- AI — AI Assistant, Copy Prompt for AI, Copy Document for AI, Import AI Output, AI Settings, Help, and Hide All AI Features — removes every AI entry point from the app (View → Show AI Features restores them).
- Help — this documentation, a live Keyboard Shortcuts reference, the built-in Getting Started example, the Getting Around hotkey tutorial (a canvas of tiles, one per key — also the third card on the empty-document welcome screen), the Tables & Formulas and SQL & Python tutorials, two example documents (a sales dashboard and a research study), Check for Updates, and Privacy.
On macOS this is the native menu bar; on Windows it's in-window. Either way, the same commands appear in the Command Palette.
Command Palette
Ctrl+K opens a fuzzy-searchable list of every command. Type a few letters, press Enter to run. Each row shows the command's current keyboard binding, so the palette doubles as a live shortcut cheat-sheet.
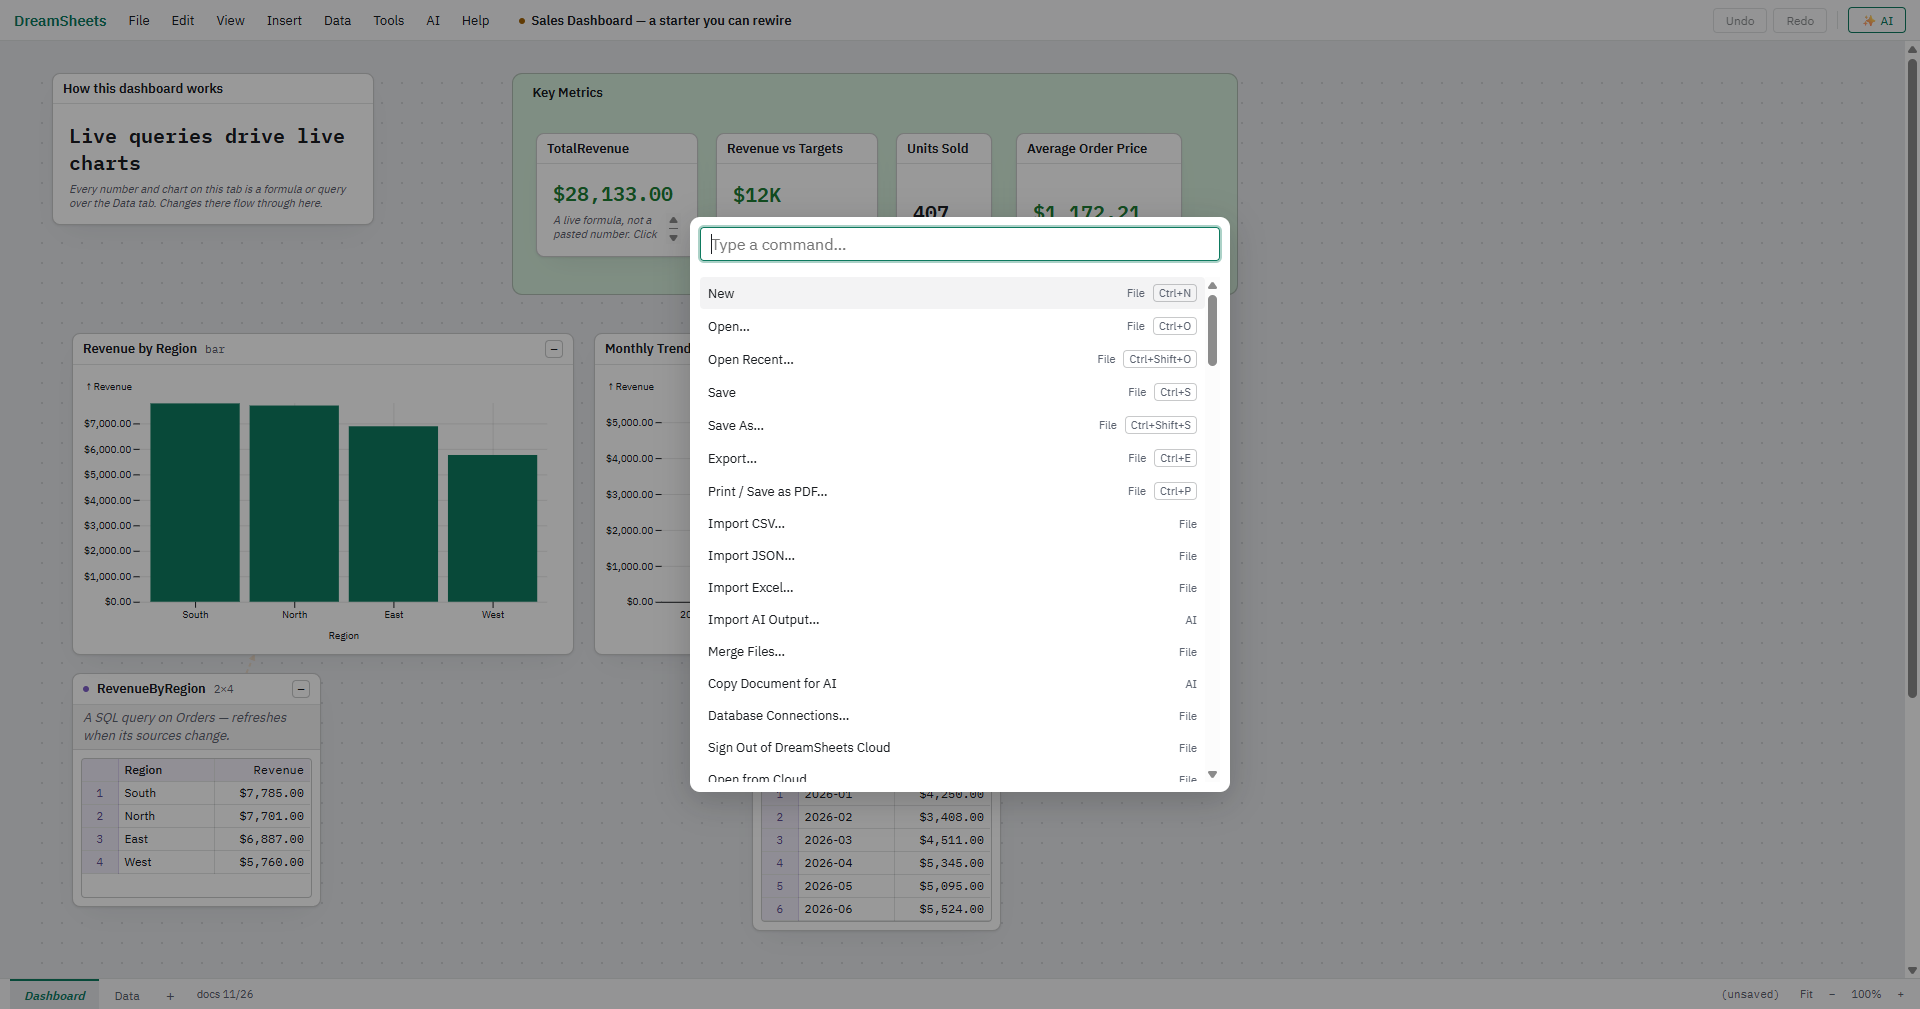
Every shortcut is rebindable via Edit → Configure Hotkeys… (a chord must include Ctrl or Alt, or be an F-key). Assigning a chord that's already in use moves it, and tells you so.
The Directory panel
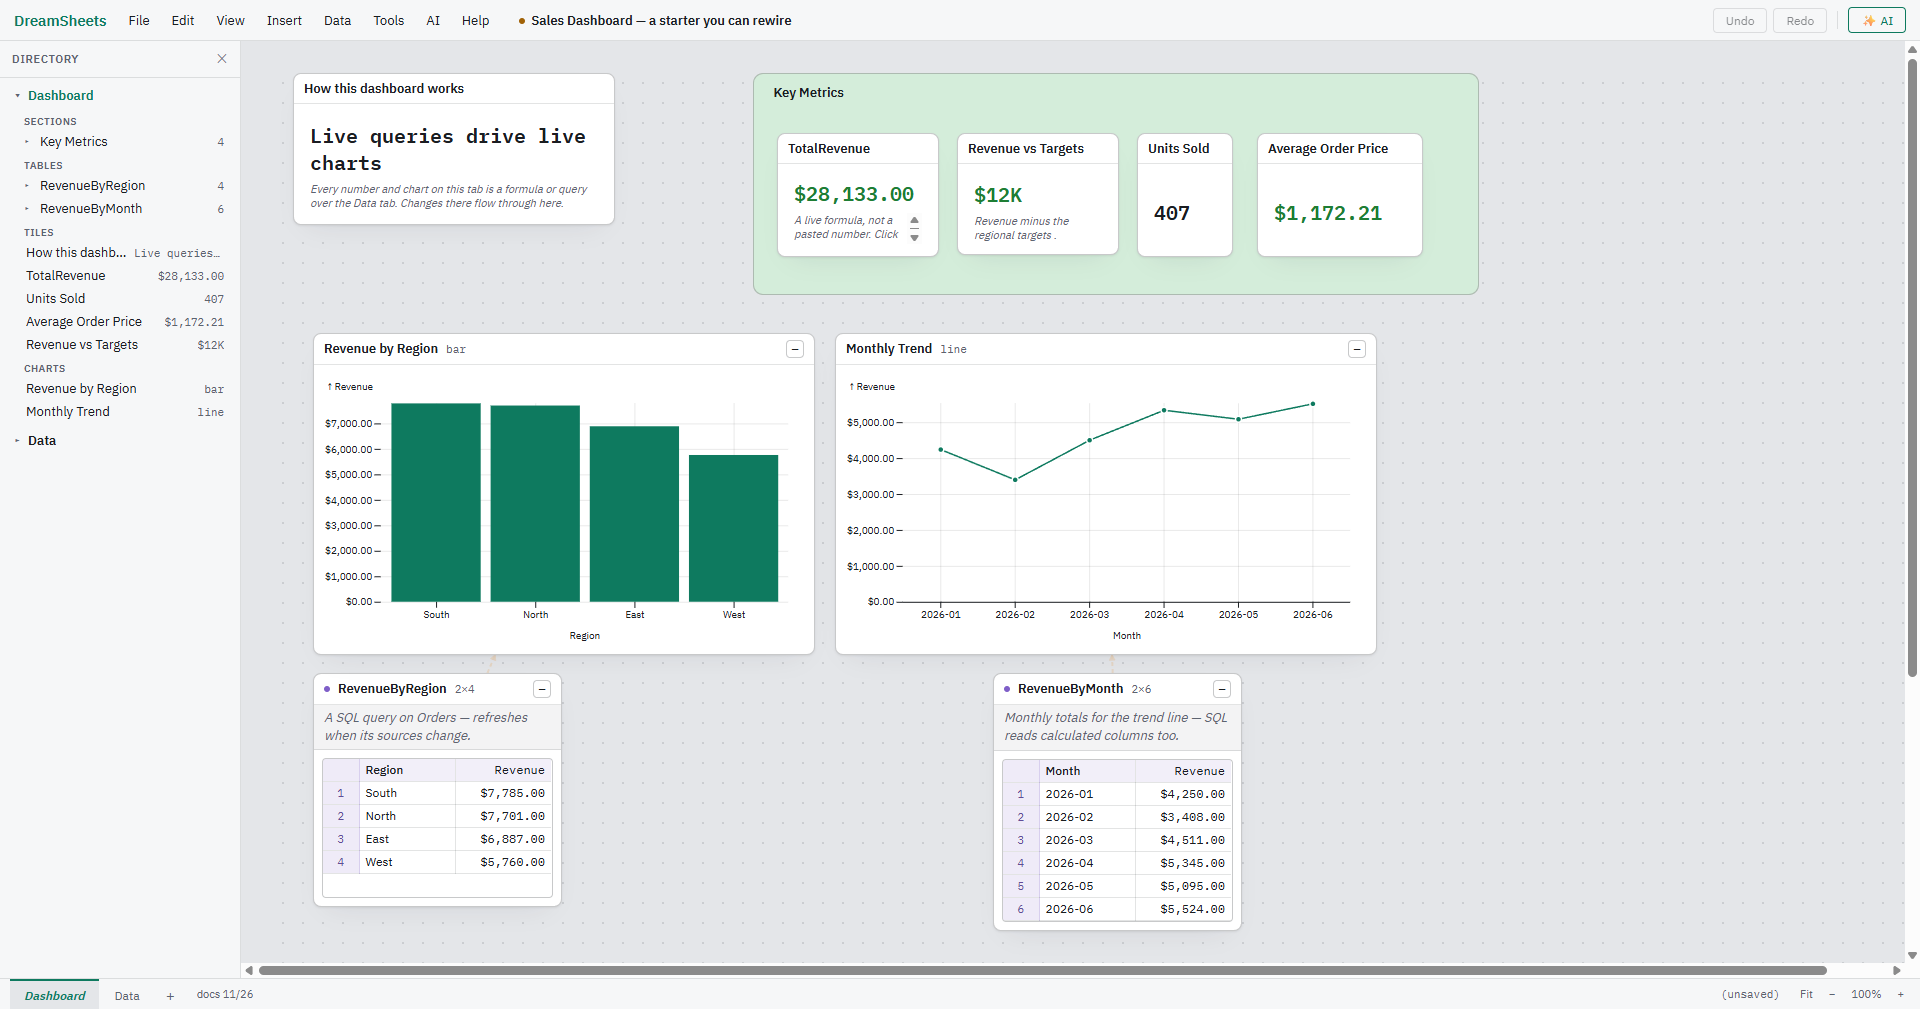
Ctrl+Shift+D toggles a left-docked outline of the whole document: every tab, with its sections (expandable to the cards they group), tables (expandable to their columns) and tiles. Double-click any entry to jump to it — switch tab, scroll into view, select, and open its editor panel. Double-clicking a hidden column unhides it.
Editor panels
Selecting an object and editing it opens a right-docked panel: the table editor, tile editor, chart editor, query editor, script editor, or the AI assistant. Formula and SQL boxes in these panels have syntax highlighting, autocomplete, and (for formulas) a live dependency view. Escape closes the panel.
Tabs
Documents can have multiple canvas tabs (like sheets). The strip at the bottom of the window: click to switch, double-click to rename, right-click for the tab menu, + to add. Ctrl+PageUp / Ctrl+PageDown cycle tabs. Formulas and charts can reference tables on any tab.
Zoom
There are two, and they do different jobs.
Canvas zoom scales your work and leaves the app's own controls alone — it's the one you reach for while working. Ctrl+= / Ctrl+- step it between 25% and 400%, Ctrl+0 returns to 100%, and Ctrl+wheel over the canvas zooms around the pointer. The status bar's Fit − 100% + controls do the same, and Fit (or Ctrl+9) picks the level that puts every card on the current tab in the window.
Interface size scales the whole app — menus, panels and canvas together — for readability, and is normally something you set once. It's on View → Interface Size (Whole App) (Larger / Smaller / Default), between 50% and 300%. In the browser editor, use your browser's own zoom instead.
Both are remembered between sessions, and View → Reset to Default Views… puts both back to 100%.
Present mode
View → Present (or F5) flips the canvas into a full-screen, read-only view for showing a document to a room: the app chrome hides and every edit is refused, but filter cards keep working — they change what's shown, not the document — so you can slice the data live while presenting. Hover any cell or tile to see the formula behind its value. Esc (or F5 again) returns to normal editing.
Appearance and theming
- View → Appearance — follow the system theme, or force Light / Dark.
- View → Colors… — a theme editor for the accent colors of each object kind (table, tile, chart, query, script) and the chart series palette, with live preview. Apply the theme to the current document (undoable), save it as your app-wide default, or import/export it as JSON.
- View → Default Format… — document-wide defaults: font family and size, text and fill colors, alignment, data-row height, the Default Number Format (how number columns without a format of their own render, and what Number starts as when you pick it), what Currency starts as (symbol, decimals), and the connector route (straight, right angles, or curved — this one also restyles the lineage arrows above). Individual tables, columns, and cells can override any of these.
The status bar
The bottom bar shows the tab strip, transient status messages (saves, AI progress, plugin messages), and the open file's path.
Autosave and crash recovery
While a document has unsaved changes, DreamSheets continuously writes a recovery snapshot in the background (debounced, so it never competes with your typing — and closing the window flushes a final snapshot). If the app ever exits without a clean save, the next launch offers Recover / Discard for each unsaved document. Recovering restores the document with its original file path, so Ctrl+S puts it right back where it belongs. A normal successful save removes the snapshot.