Getting started
Install DreamSheets, build your first document, and learn where everything lives.
DreamSheets is a native desktop spreadsheet built around a different idea: instead of one endless grid, you work on a canvas of named tables — plus KPI tiles, charts, scripts, and images — connected by formulas that reference everything by name.
Install
DreamSheets runs on macOS, Windows, and Linux (as an AppImage). Download the app, run the installer, and launch it.
Licensing. The first run starts a 7-day free trial with every feature enabled. A one-time license (bought on the pricing page) is entered under File → License… — the key is validated locally, no account or server required. The same dialog shows how many trial days remain, and its Deactivate button removes the key from a machine so you can activate it on another. An ended trial never locks your work: .dsheet documents are ordinary files on your own disk either way.
The one big idea
In Excel, a "table" is a region of cells you keep tidy by convention. In DreamSheets, a table is a real object: it has a name, typed columns, and it lives as a card on the canvas. Formulas reference data by name, not by address:
SUM(Sales.Amount)          instead of    =SUM(B2:B900)
@Price * @Qty              instead of    =C2*D2 (copied down 900 rows)
Because names are the only references, formulas never break when you move things, sort rows, or add columns — and every document reads like it was written to be understood.
Your first document
- Create a table. Use Insert → Table, or drag a rectangle on the empty canvas and pick Table from the popup. Double-click the header to name it — say
Sales— and name your columns (Region,Amount). - Enter data. Click a cell and type. Enter moves down, Tab moves right, and typing at the table's edge grows it. Paste from Excel or a CSV works too.
- Add a calculated column. Right-click a header, choose Insert column right, type its name, and press Tab. Give it a formula like
@Amount * 1.08. It computes for every row, and updates when the data changes. - Add a tile. Insert → Tile creates a single-value KPI card. Give it a name like
Totaland the formulaSUM(Sales.Amount). Tiles are values other formulas can reference by name — a named constant (TaxRate= 0.08) or a live KPI. - Add a chart. Insert → Chart, pick the
Salestable, putRegionon X andAmounton Y. Charts update live as data changes. - Save. Ctrl+S writes a
.dsheetfile — a zip of JSON plus one parquet file per table, fast to open even with a million rows.
Where things live
- The canvas holds your objects; scroll to pan, drag cards to arrange them. See The canvas & interface.
- The menu bar (File / Edit / View / Insert / Data / Tools / AI / Help) holds every command; the Command Palette (Ctrl+K) finds any of them by name and doubles as a shortcut cheat-sheet.
- The Directory panel (Ctrl+Shift+D) lists every tab, table, tile, and column — double-click anything to jump to it.
- Undo covers everything — data edits, formatting, moves, imports, even changes made by the AI assistant. Ctrl+Z is always safe.
Bringing in existing work
- CSV: File → Import CSV… — column types are inferred automatically.
- Excel: File → Import Excel… — each worksheet becomes a tab, formulas are translated to live calc columns when the translation provably reproduces Excel's own values, and everything else is kept as static data with its original formula preserved. See Import & export.
Where to go next
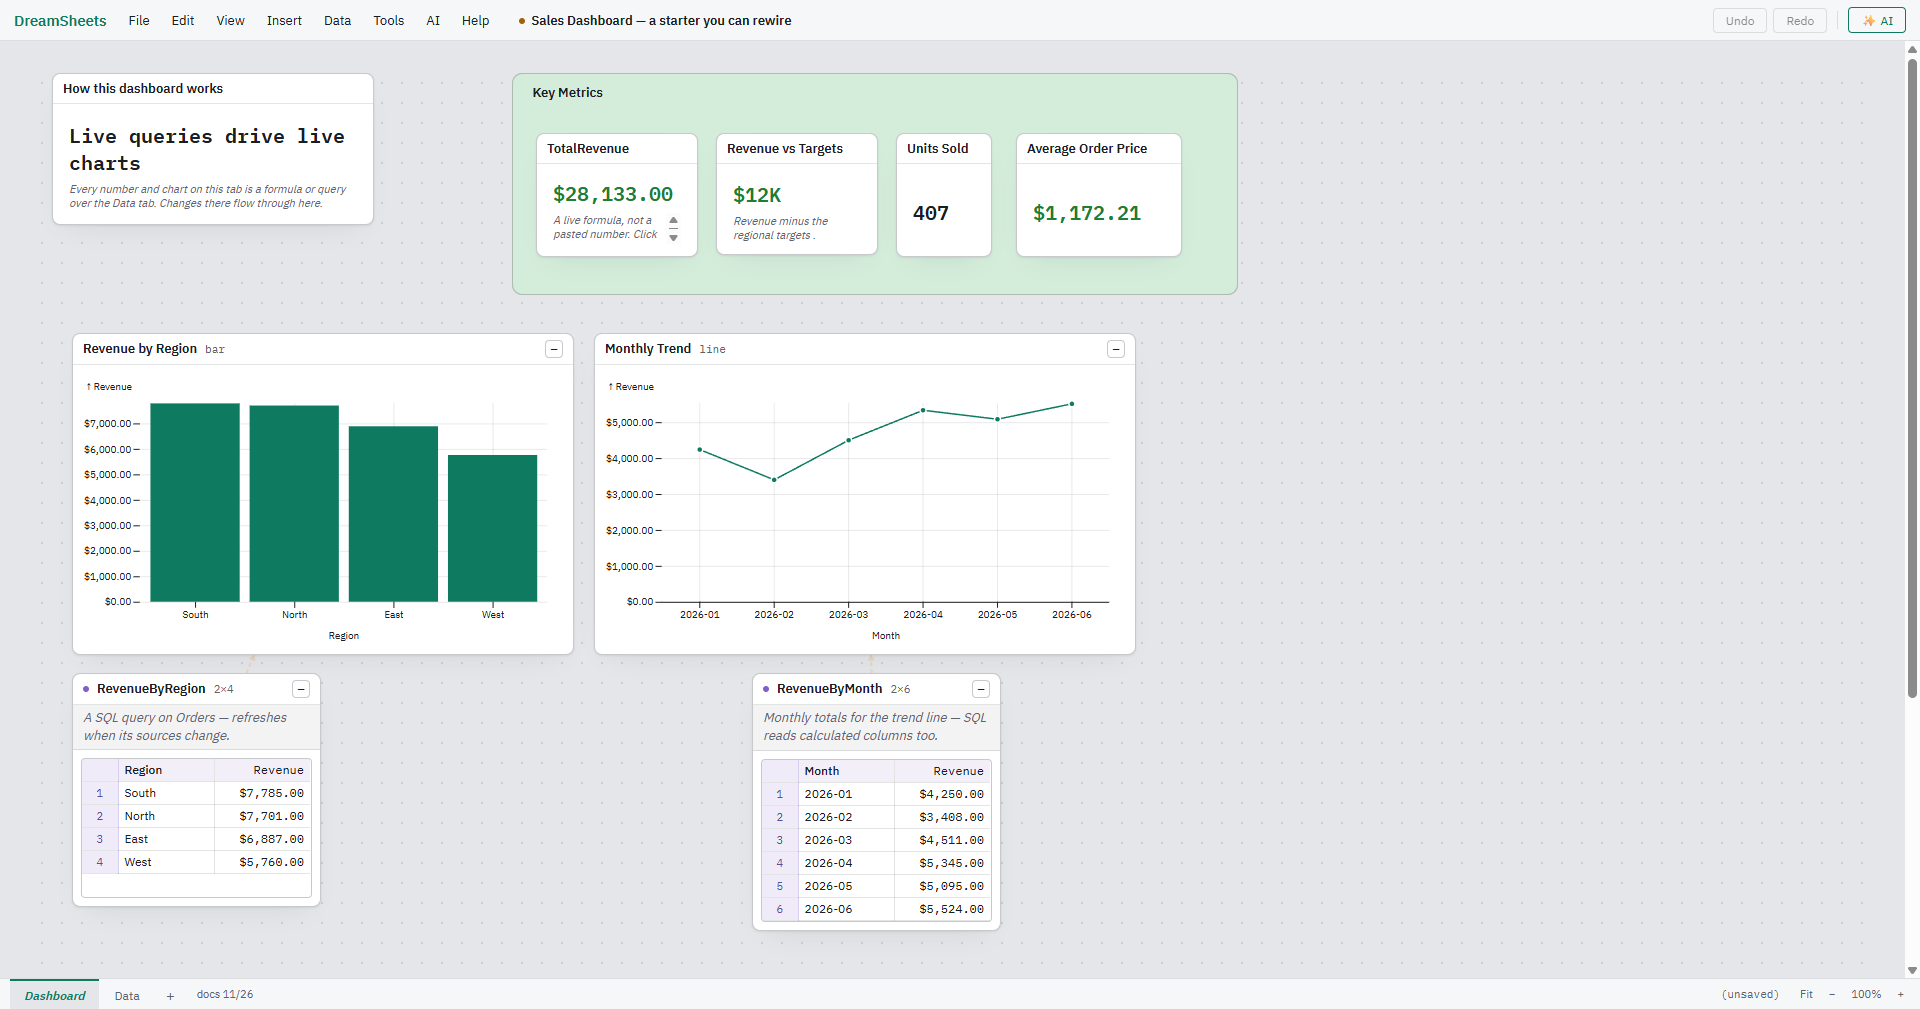
- The Help menu opens worked documents right in the app: Tables & Formulas Tutorial, SQL & Python Tutorial, and two complete examples — Example: Sales Dashboard and Example: Research Study.
- The canvas & interface — how the workspace behaves.
- Tables — columns, formats, filters, summary rows, validation.
- Formula language and the function reference.
- AI assistance — an assistant that edits your document with undoable actions.
- Connecting AI tools — drive DreamSheets from Claude or any MCP client.